The resulting data rate mainly depends on the following conditions:
It is more or less impossible to test a certain card under all conditions. The selected test procedure includes 128 different test runs from the following combinations: Read/write, sequential/skipping, aligned/unaligned, small/large total size with eight different transfer sizes. The total size for small read/write is 1MB with transfer sizes from 1kB to 128kB, resulting in 1024×1kB to 8×128kB units. The total size for large read/write is 64MB with transfer sizes from 256kB to 32MB, resulting in 256×256kB to 2×32MB units.
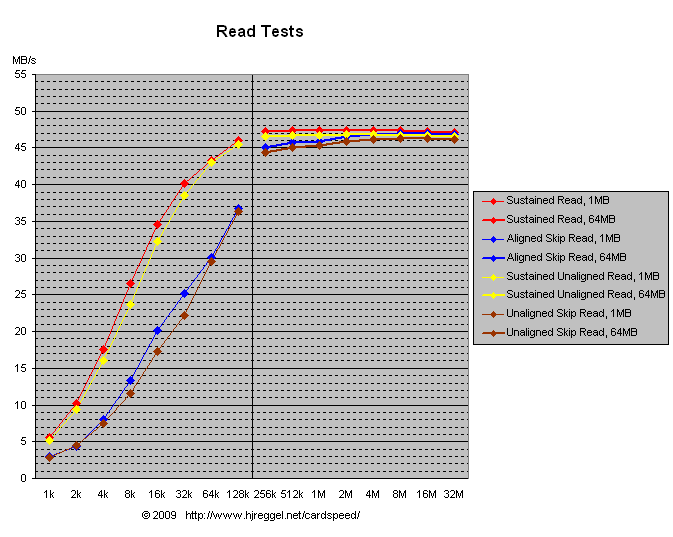
The test results are combined into two graphs, one for all read tests, and one for all write tests. The read graphs for different cards look very similar, but the write graphs differ a lot.
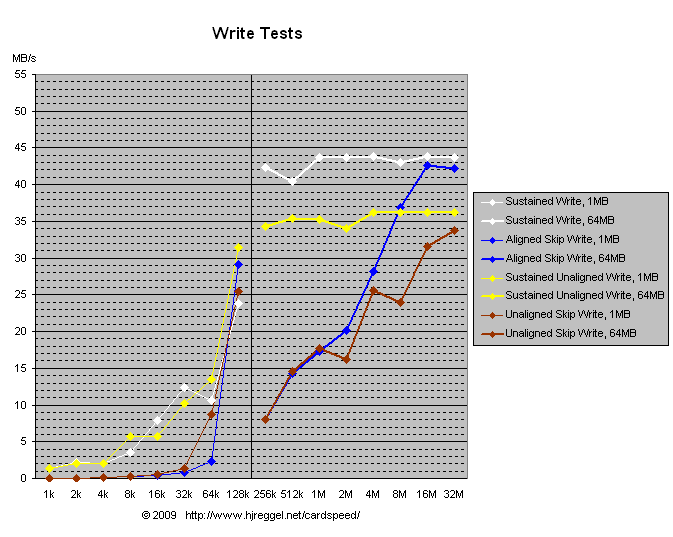
Below is an example for a write graph...

Above: Sample graph from a write test run.
Colors:
As usual, the graphs show read in red
and write in white. These are the results
for aligned sequential read/write.
The other three colors
are the same for both graphs:
Yellow for unaligned sequential,
blue for aligned skipping,
brown for unaligned skipping.
Left/Right:
The left half with thin lines shows the test results
from a total of 1MB,
the right half with thick lines shows the test results
from a total of 64MB.
Values:
The X-Axis shows the data size that was used for
the read/write calls to the operating system.
Results:
The Y-Axis shows the measured transfer rate,
as usual in binary calculation,
where 1MB/s = 220 Bytes per second.
The scale is chosen according to the speed category of the card:
20MB/s for PIO-6 cards,
35MB/s for slow UDMA cards,
55MB/s for the "first generation" UDMA cards,
and 100MB/s for the "second generation" UDMA cards.
Below: Sample graph from a read test run.

For the moment, I don't want to draw any specific conclusions. The test runs are in progress, graphs will be created and publised step by step.